MATHCAD SIMULATION
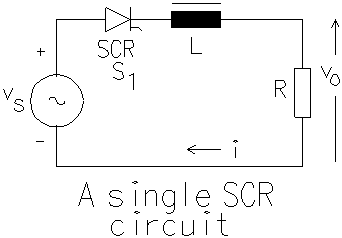
There is current through the load at the instant wt = p radians and the SCR continues to conduct till the energy stored in the inductor becomes zero. After that the current tends to flow in the reverse direction and the SCR blocks conduction. The entire applied voltage now appears across the diode.
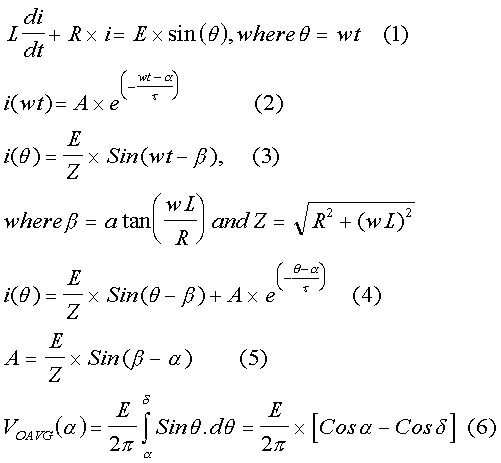
An expression for the current through the SCR can be obtained as shown below. It is assumed that the current flows for a < wt < d, where d > p . When the SCR conducts, the driving function for the differential equation is the sinusoidal function defining the source voltage. Outside this period, the SCR blocks current and acts as an open switch. For this period, there is no equation defining the behaviour of the circuit. For a < wt < d , equation (1) applies. Given a linear differential equation, the solution is found out in two parts. The homogeneous equation is given by equation (2), where a is the firing angle. The value of constant A in the complimentary solution is to be evaluated later. The particular solution is the steady-state response and is diplayed as equation (3). The total solution is the sum of both the complimentary and the particular solution and is presented as equation (4). The value of A is obtained using the initial condition. Since the SCR starts conducting at wt = a and the current starts building up from zero, i(a) = 0. In the expression above t = wL/R. Then A can be expressed as in equation (5).
Once the value of A is known, the expression for current is known. When the firing angle a and the extinction angle d are known, the average output voltage at the cathode of the SCR can be evaluated as shown in equation (6).
The average load current can be obtained by dividing the
average load voltage by the load resistance, since the average voltage
across the inductor is zero.
SIMULATION
The operation of the circuit can be simulated as shown below. In order to simulate, the solution for current is presented in the following form, where t = (wL)/R. Then
Again it is preferable to normalize. Here E is set to unity and E/R is also set to unity. Then
vs = sin (wt).
vo = vs - i for a < wt < d, and
vL = vs - i for a < wt < d .
To solve the expression, all we need to know is then the ratio t. The applet shown below simulates this circuit. You have to key-in the ratio t and then click on the button next to it. Do not key-in a NaN. Enter the ratio t in the left text-field to the left of the click button and the firing angle in degrees in the textfield to its right.
The next page presents the same circuit with a free-wheeling
diode.
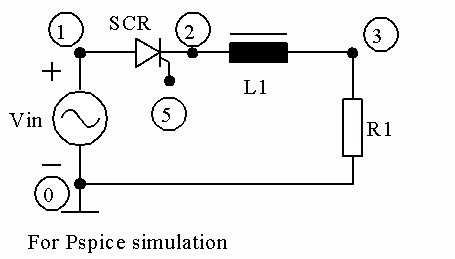
* Half-wave Rectifier with RL Load
* A problem to find the SCR current
VIN 1 0 SIN(0 340V 50Hz)
XT1 1 2 5 2 SCR
VP 5 2 PULSE(0 10 1667U 1N 1N 100U 20M)
L1 2 3 31.8MH
R1 3 0 10
* Subcircuit for SCR
.SUBCKT SCR 101 102 103 102
S1 101 105 106 102 SMOD
RG 103 104 50
VX 104 102 DC 0
VY 105 107 DC 0
DT 107 102 DMOD
RT 106 102 1
CT 106 102 10U
F1 102 106 POLY(2) VX VY 0 50 11
.MODEL SMOD VSWITCH(RON=0.0105 ROFF=10E+5 VON=0.5 VOFF=0)
.MODEL DMOD D((IS=2.2E-15 BV=1200 TT=0 CJO=0)
.ENDS SCR
.TRAN 10US 60.0MS 20.0MS 10US
.PROBE
.OPTIONS(ABSTOL=1N RELTOL=.01 VNTOL=1MV)
.END
The waveforms obtained are presented below.
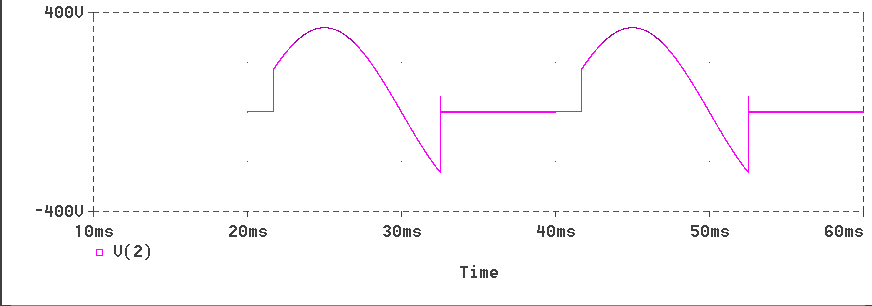
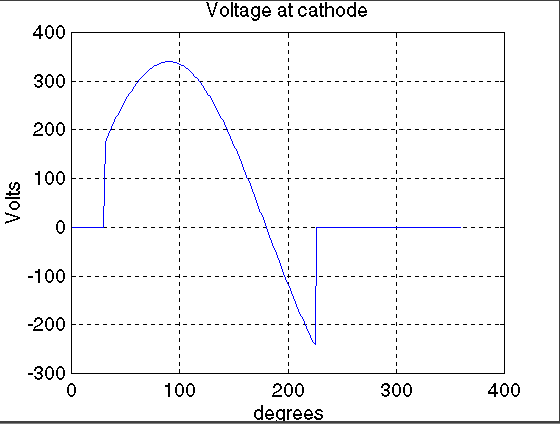
The voltage waveform at the cathode of the SCR
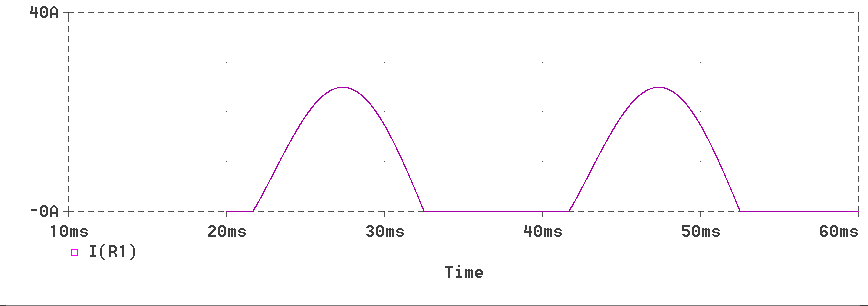
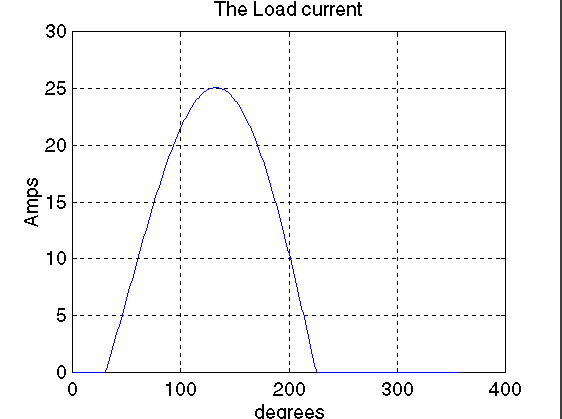
The load current waveform
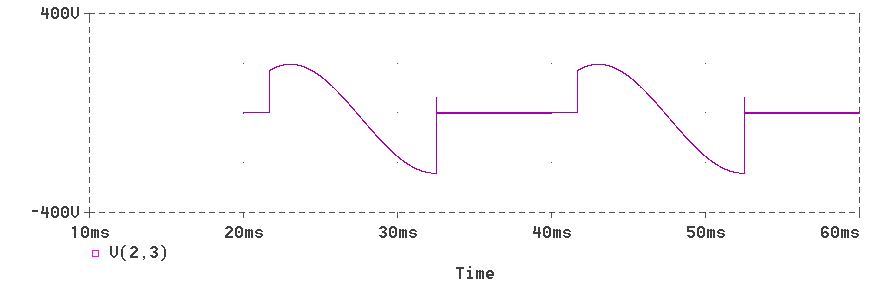
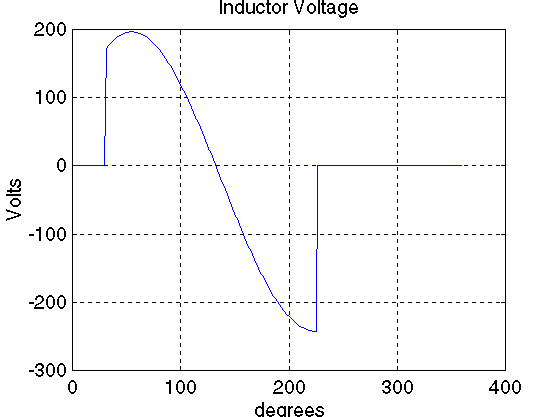
The inductor voltage waveform
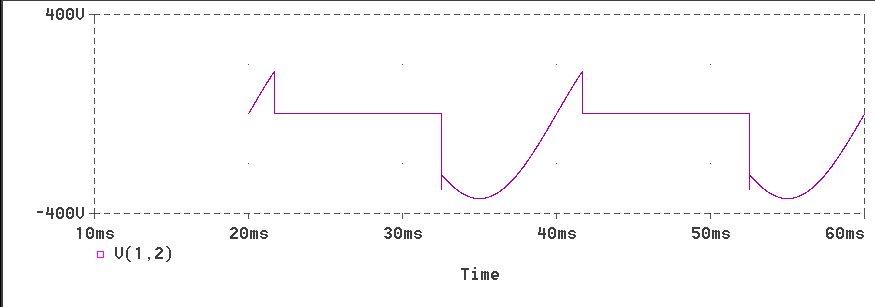
The voltage waveform acros the SCR
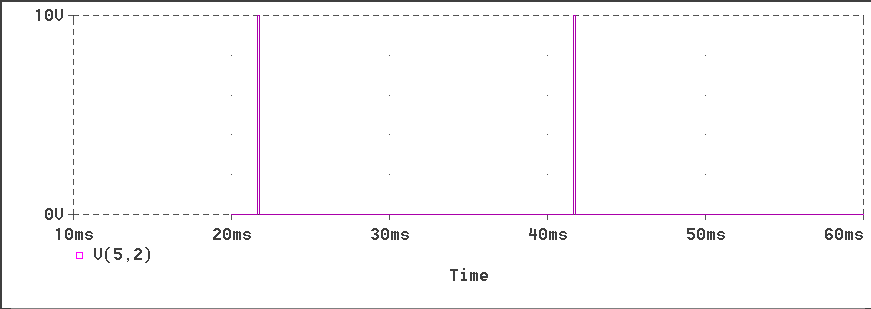
The voltage waveform of the pulse source used for triggering
the SCR
% Program to simulate the half-wave controlled rectifier circuit
% Enter the peak voltage, frequency, inductance L in mH and resistor R
disp('Typical value for peak voltage is 340 V')
peakV=input('Enter Peak voltage in Volts>');
disp('Typical value for line frequency is 50 Hz')
freq=input('Enter line frequency in Hz>');
disp('Typical value for Load inductance is 31.8 mH')
L=input('Enter Load inductance in mH>');
disp('Typical value for Load Resistance is 10.0 Ohms')
R=input('Enter Load Resistance in Ohms>');
disp('Typical value for Firing angle is 30.0 degree')
fangDeg=input('Enter Firing angle within range 0 to 180 in deg>');
fangRad=fangDeg/180.0*pi;

w=2.0*pi*freq;
X=w*L/1000.0;
if (X<0.001) X=0.001; end;
Z=sqrt(R*R+X*X);
tauInv=R/X;
loadAng=atan(X/R);
A=peakV/Z*sin(loadAng-fangRad);

Ampavg=0;
AmpRMS=0;

for n=1:360;
  theta=n/180.0*pi;
  X(n)=n;
  if (n<fangDeg)
    cur=0.0;
        Vind(n)=0;
        iLoad(n)=0;
    Vout(n)=0;
  else
    cur=peakV/Z*sin(theta-loadAng)+A*exp(-tauInv*(theta-fangRad));
    if (cur>0)
      Ampavg=Ampavg+cur*1/360;
          AmpRMS=AmpRMS+cur*cur*1/360;
          Vind(n)=peakV*sin(theta)-R*cur;
          iLoad(n)=cur;
      Vout(n)=peakV*sin(theta);
    else
      Vind(n)=0;
      iLoad(n)=0;
      Vout(n)=0;
    end;
  end;
end;


plot(X,iLoad)
title('The Load current')
xlabel('degrees')
ylabel('Amps')
grid
pause

plot(X,Vout)
title('Voltage at cathode')
xlabel('degrees')
ylabel('Volts')
grid
pause

plot(X,Vind)
title('Inductor Voltage')
xlabel('degrees')
ylabel('Volts')
grid


AmpRMS=sqrt(AmpRMS);
[A,message]=fopen('hwavec1.dat','w');
fprintf(A,'Avg Load Cur=\t%d\tRMS Load Cur=\t%f\n',Ampavg,AmpRMS);
fclose(A)
The waveforms obtained for the typical specified values are
displayed now.
The output file containing the values of average load current and the RMS load current is presented below.
Avg Load Cur= 8.481852e+000 RMS Load Cur= 12.878237
This page has described how the half-wave controlled rectifier circuit operates. The next page shows how the behaviour of this circuit can be changed by adding a free-wheeling diode.