When the current flow in the dc link is continuous, the
average output voltage can be calculated as outlined in the previous page.
It is difficult to estimate what the average output would be if there
is a source present in the dc link and the conduction is discontinuous.
If there be no source in the dc link, the average output voltage for discontinuous
conduction is expressed by equation (1). The
analysis of the circuit is along the lines described for the single-phase
controlled rectifier circuit. In order to get an expression for the
line/phase current, it is necessary to get an expression for the load current.
The expression for load current is obtained from the expression for output
voltage. The output voltage is described by equation (2).
The differential equation that describes the load current
is expressed by equation (3). The solution is
of the form expressed by equation (4). The impedance
of load is Z and the load angle is f.
They are defined as shown in equation (5).
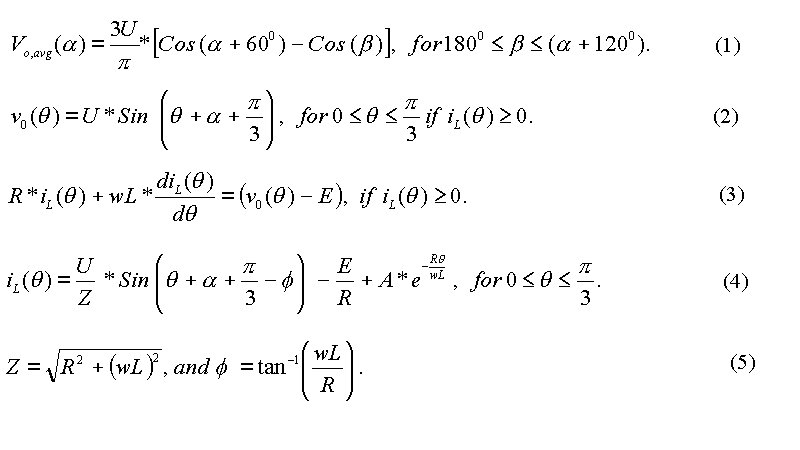
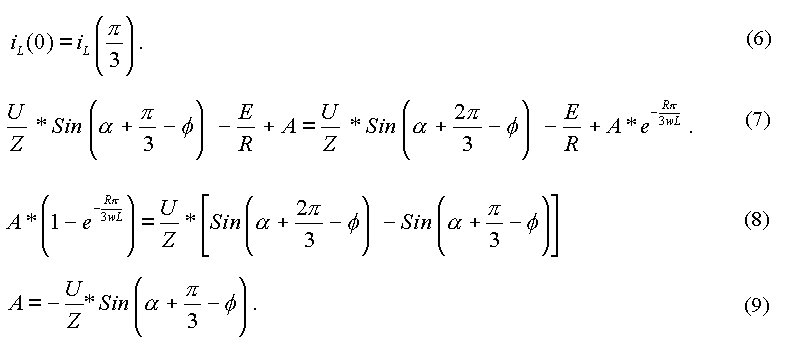
In the equation above, w is the angular frequency in radians/second
corresponding to the source frequency. When the load current is continuous,
equation (6) is valid. Using equation (6),
equation (7) is obtained. Solving for A, we
get equation (8). When the conduction is discontinuous, iL(0)
= 0 and then A is evaluated as shown in equation (9).
Once the value of A is known, the load current can be
found out. From the load current, an expression for the line current
can be obtained. When SCR S1 is ON, the line current
equals the load current. The line current is the negative of load
current when SCR S4 is ON, and it is zero when neither S1
nor S4 is ON. From the expression of the load current,
the rms value of line current, the rms value of the fundamental component
of line current, the THD in line current, the harmonic spectrum of line
current, the DPF and the apparent power factor can be determined as outlined
in the earlier pages.
The parameters to be keyed in are the firing angle, the
value of source in the dc link (between 1.0 and -1.0 preferably) and the
ratio of load reactance to load resistance. The load reactance is
wL, where w is the angular frequency in rad/s corresponding to the
ac source frequency. Click on Start Button for the program
to respond.
* Three-phase Full-wave Fully-Controlled Bridge Rectifier
VA 1 0 SIN(0 340V 50Hz)
VB 2 0 SIN(0 340V 50Hz 0 0 -120)
VC 3 0 SIN(0 340V 50Hz 0 0 -240)
XT1 1 4 11 4 SCR
XT3 2 4 13 4 SCR
XT5 3 4 15 4 SCR
XT4 5 1 14 1 SCR
XT6 5 2 16 2 SCR
XT2 5 3 12 3 SCR
RP 4 0 100K
RN 5 0 100K
R1 4 6 10
L1 6 5 31.8M

VP1 21 0 PULSE(0 10 3333.3U 1N 1N 100U 20M)
VP2 22 0 PULSE(0 10 6666.7U 1N 1N 100U 20M)
VP3 23 0 PULSE(0 10 10M 1N 1N 100U 20M)
VP4 24 0 PULSE(0 10 13333.3U 1N 1N 100U 20M)
VP5 25 0 PULSE(0 10 16666.7U 1N 1N 100U 20M)
VP6 26 0 PULSE(0 10 0M 1N 1N 100U 20M)
RP1 21 0 100K
RP2 22 0 100K
RP3 23 0 100K
RP4 24 0 100K
RP5 25 0 100K
RP6 26 0 100K
EP1 11 4 poly(2) (21,0) (22,0) 0 1 1
EP2 12 3 poly(2) (22,0) (23,0) 0 1 1
EP3 13 4 poly(2) (23,0) (24,0) 0 1 1
EP4 14 1 poly(2) (24,0) (25,0) 0 1 1
EP5 15 4 poly(2) (25,0) (26,0) 0 1 1
EP6 16 2 poly(2) (26,0) (21,0) 0 1 1


* Subcircuit for SCR
.SUBCKT SCR 101 102 103 102
S1 101 105 106 102 SMOD
RG 103 104 50
VX 104 102 DC 0
VY 105 107 DC 0
DT 107 102 DMOD
RT 106 102 1
CT 106 102 10U
F1 102 106 POLY(2) VX VY 0 50 11
.MODEL SMOD VSWITCH(RON=0.0105 ROFF=10E+5 VON=0.5 VOFF=0)
.MODEL DMOD D((IS=2.2E-15 BV=1200 TT=0 CJO=0)
.ENDS SCR


.TRAN 10US 60.0MS 0.0MS 10US
.PROBE
.FOUR 50 V(4,5) I(VA) I(L1)
.OPTIONS(ABSTOL=1N RELTOL=.01 VNTOL=1MV)
.END
The results of the Fourier series analysis are presented below.
The Fourier Series Spectrum of the output voltage
It can be seen that the lowest harmonic frequency in the output voltage is at 300 Hz, the sixth harmonic, whereas there is hardly any harmonic present in the load current because of the relatively large inductance in the load circuit. On the other hand, the 5-th and the 7-th harmonics are visibly high in the line current.
The Matlab file can be downloaded by clicking on the image
below.
![]()
This page has described the operation of the three-phase fully-controlled bridge rectifier circuit with an RL load. The next page shows the effect of adding source inductance.
![]()
![]()
![]()
![]()